LLM Eval / Monitoring Dashboard
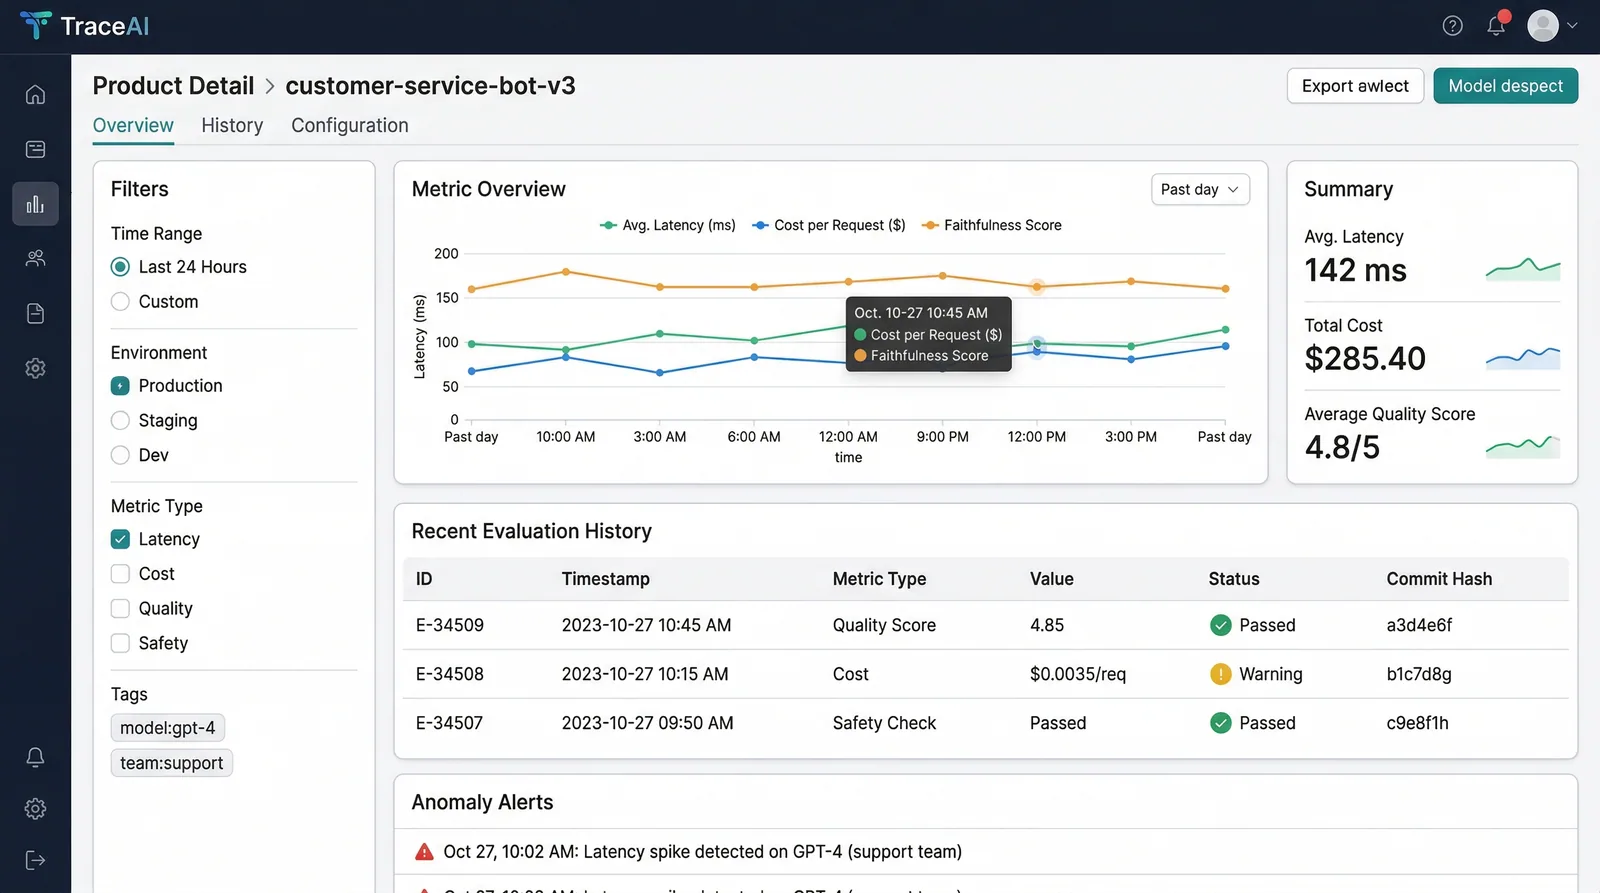
Production observability platform for AI applications tracking accuracy, latency, costs, and toxicity across 10k+ inferences daily with live dashboards updating every 100ms.
My Role
Full-stack engineer — designed the observability architecture, built the evaluation pipeline, real-time dashboard, and CI/CD integration.
Duration
3.5 months
Year
2026
Tech Stack
Status
Live in ProductionProduction observability platform for AI applications tracking accuracy, latency, costs, and toxicity across 10k+ inferences daily with live dashboards updating every 100ms.
Most AI teams ship models without knowing if they work in production. There's no standard way to track accuracy, latency, and costs across thousands of daily inferences, detect quality regressions before users notice, or prove to stakeholders that the AI system actually meets its SLAs. Teams discover degradation from user complaints, not metrics.
I built a production observability platform that instruments AI applications with OpenTelemetry, evaluates every inference across 15 quality metrics using DeepEval, stores results in ClickHouse for sub-100ms dashboard queries, and integrates with CI/CD to block deployments when evaluation scores drop below thresholds.
Real-time Inference Monitoring
OpenTelemetry-instrumented pipeline tracks every LLM call — latency (p50/p95/p99), token usage, cost per inference, and error rates — with 100ms dashboard refresh cycles.
15-Metric Evaluation Suite
DeepEval runs faithfulness, relevancy, hallucination detection, toxicity, bias, coherence, and 9 more metrics on every inference. RAGAS scores for RAG-specific quality assessment.
CI/CD Deploy Gates
Evaluation suites run as pytest fixtures in the CI pipeline. PRs that reduce any metric below the configured threshold are automatically blocked with detailed regression reports.
Anomaly Detection + Alerting
Statistical anomaly detection on rolling metric windows triggers PagerDuty and Slack alerts when quality deviates >2σ from the 7-day moving average.
Key technology choices and the reasoning behind each decision.
ClickHouse
DataChose ClickHouse over TimescaleDB for metric storage because of its columnar compression and 10-50x faster aggregation queries at our scale (1B+ rows). Dashboard queries that took 3s in Postgres return in 80ms in ClickHouse.
Tremor v3.0
FrontendSelected Tremor over custom D3 charts because its pre-built dashboard components match the observability UX patterns that engineering teams already expect. Reduced frontend development time by 60%.
OpenTelemetry
InfrastructureChose OTel over custom instrumentation for vendor neutrality. Teams can export traces to Datadog, Grafana, or Jaeger without changing application code. The semantic conventions also standardize metric naming across services.
DeepEval 0.4.2
AI / MLSelected DeepEval over custom eval scripts because of its pytest integration and pre-built metric library. Defining evaluation suites as test files lets us reuse existing CI infrastructure without building a separate eval platform.
Full-stack observability from instrumentation to real-time dashboards with CI/CD integration.
Instrumentation
OpenTelemetry SDK wraps LLM calls → Captures latency, tokens, cost, response
Evaluation
DeepEval runs 15 metrics on each inference → Scores stored alongside trace data
Storage
ClickHouse ingests metric events → Columnar compression for sub-100ms queries on 1B+ rows
Dashboard
Next.js + Tremor renders real-time charts → Accuracy, latency, cost, toxicity panels
Alerting
Anomaly detection on rolling windows → PagerDuty + Slack for quality regressions
CI/CD Gate
pytest eval suites in CI → Block deploy if any metric drops below configured threshold
Key technical challenges I faced and how I solved them.
Dashboard Performance at Scale
With 10k+ inferences per day generating 15 metrics each, the dashboard queries were scanning 150k+ rows per chart update. Initial Postgres implementation took 3-5 seconds per dashboard load — unusable for real-time monitoring.
Migrated metric storage to ClickHouse with materialized views for common aggregations (hourly/daily rollups). Implemented query result caching in Redis with 10-second TTL for the most-viewed dashboard panels.
Dashboard load time dropped from 4.2s to 180ms. Engineers now keep the dashboard open as a persistent monitoring tab.
Evaluation Overhead in Production
Running 15 DeepEval metrics on every inference added 800ms+ of latency and doubled LLM costs (each metric requires additional LLM calls for judgment). This was unacceptable for latency-sensitive production paths.
Implemented async evaluation — inference results are returned immediately while metrics are computed in a background queue (Celery + Redis). For CI/CD gates, synchronous evaluation runs on a representative sample (5%) rather than all inferences.
Zero added latency to production inference. Async evaluation queue processes with a median lag of 12 seconds — fast enough for real-time dashboard updates.
Interested in working with TwilightCore?
We build production systems like this for teams and founders who value quality engineering.