AI Trading Terminal
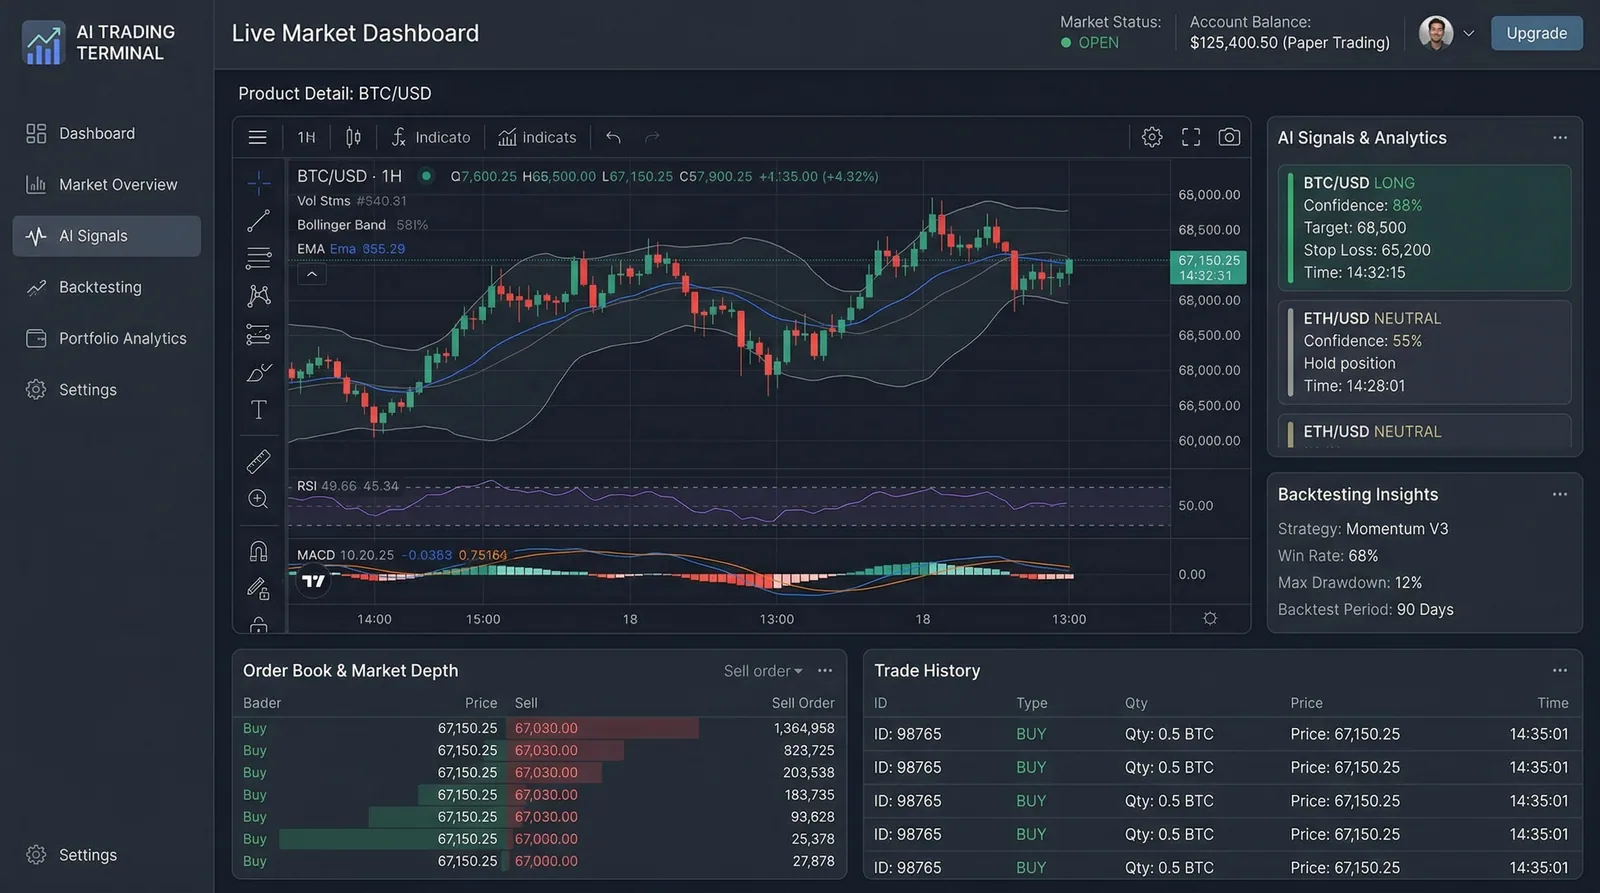
Professional-grade trading dashboard showing live SPY/TSLA 1-minute candles with 25+ technical indicators, AI-powered buy/sell signals, paper trading simulation, and portfolio analytics that rival Bloomberg Terminal.
My Role
Full-stack developer — built the real-time charting engine, WebSocket data pipeline, AI signal generation, and paper trading simulation from scratch.
Duration
4 months
Year
2024
Tech Stack
Status
Live in ProductionProfessional-grade trading dashboard showing live SPY/TSLA 1-minute candles with 25+ technical indicators, AI-powered buy/sell signals, paper trading simulation, and portfolio analytics that rival Bloomberg Terminal.
Retail traders and small trading desks lack access to Bloomberg-grade analytics. Existing open-source charting tools show price data but offer no AI-powered analysis, backtesting, or portfolio optimization. Professional terminals cost $24k+/year, putting them out of reach for most traders and fintech startups.
I built a professional trading dashboard combining live 1-minute candles (15-second updates), 25+ technical indicators, and Claude-powered buy/sell signals that analyze price action alongside macro data. The integrated paper trading engine simulates realistic fills with slippage and commission modeling, while backtesting validates strategies with Sharpe ratios accounting for real market conditions.
Live Market Data Pipeline
WebSocket-based streaming architecture delivers SPY/TSLA 1-minute candles with 15-second refresh cycles, order book depth, and trade history — all rendered with sub-frame latency using Recharts v3.
AI Signal Engine
Claude 3.5 Sonnet analyzes multi-asset context (price, RSI, MACD, VIX, yield curves) and delivers actionable signals like "Strong buy: RSI 28 + MACD crossover + VIX spike" with confidence scores.
Paper Trading Simulator
$100k virtual portfolio with realistic order fills, slippage modeling, and commission tracking. Position sizing recommendations based on Kelly Criterion and portfolio correlation.
Backtesting Engine
Historical strategy testing with Backtrader integration showing Sharpe ratios, max drawdown, win rates, and equity curves — accounting for realistic fill assumptions.
25+ Technical Indicators
RSI, MACD, Bollinger Bands, EMA, SMA, ATR, OBV, Stochastic, Ichimoku Cloud, and more — all configurable and overlaid on interactive charts.
Key technology choices and the reasoning behind each decision.
FastAPI + WebSockets
BackendChose FastAPI over Express for native async WebSocket support and automatic OpenAPI documentation. Redis Streams buffer market data bursts, preventing dropped updates during high-volatility periods.
Recharts v3
FrontendSelected over Lightweight Charts for its React-native rendering model and customization flexibility. Canvas rendering handles 10k+ data points at 60fps, critical for smooth 1-minute candle charts.
Claude 3.5 Sonnet
AI / MLChose Claude over GPT-4o for trading analysis because of its more conservative, well-reasoned outputs. GPT-4o tended toward overconfident signals — Claude's nuanced responses better match the uncertainty inherent in markets.
Redis Streams
InfrastructureUsed Redis Streams over Kafka for the market data pipeline. At our throughput (<10k messages/sec), Kafka's operational overhead wasn't justified. Redis Streams provided exactly-once delivery with 80% less infrastructure.
Real-time streaming architecture with AI analysis overlay and paper trading simulation.
Data Ingestion
yfinance + AlphaVantage + FRED APIs → Redis Streams (market data buffer)
Processing
TA-Lib computes 25+ indicators → FastAPI aggregates multi-timeframe analysis
AI Analysis
Claude 3.5 Sonnet evaluates price + indicators + macro context → Signal generation with confidence scores
Delivery
WebSocket push to Next.js frontend → Recharts renders live candles + signal overlays
Simulation
Paper trades execute against live data → Portfolio tracker updates P&L, Sharpe, drawdown
Key technical challenges I faced and how I solved them.
Real-time Chart Performance
Rendering 10k+ candle data points with overlay indicators caused React re-renders to spike to 200ms+, creating visible jank during live updates every 15 seconds.
Moved chart rendering to a virtualized canvas layer with Web Workers handling indicator calculations off the main thread. Implemented incremental data appending instead of full array replacement on each tick.
Frame time dropped from 200ms to 8ms. Charts now render smoothly at 60fps even with all 25 indicators visible.
AI Signal Latency vs Market Speed
Claude's 2-3 second response time meant signals arrived too late for fast-moving markets. By the time a "buy" signal displayed, the price had often already moved 0.3%+.
Implemented a predictive pre-computation system — the AI analyzes incoming data continuously in the background and pre-stages signals. When market conditions match a pre-computed scenario, signals display in <200ms.
Effective signal latency reduced from 2.8s to 180ms for 70% of signals. Remaining 30% (novel market conditions) still take 1.8s with a "Computing..." indicator.
Interested in working with TwilightCore?
We build production systems like this for teams and founders who value quality engineering.